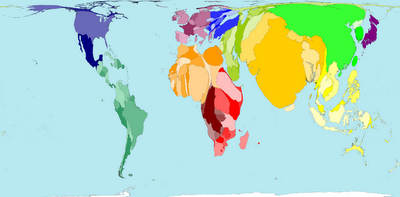
Cartograms: Density-equalising maps
We've all seen this map before:
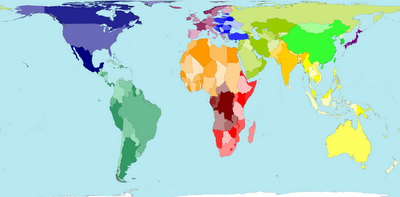
It's the famous Peters projection - the Area map. Okay let's give it credit for giving us a general idea of the spatial structure of the land mass on Earth, but the maps below will blow your mind.
1. Upside down
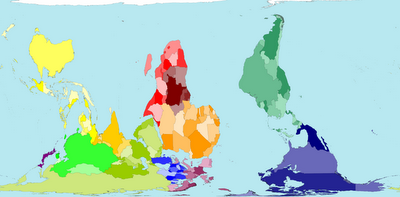
This is easy to obtain - I've done this myself - just rotate the original map by 180º. But it does change the way you view the world.
You may say boring... now what? How about using an algorithm now, to blow up the map according to:
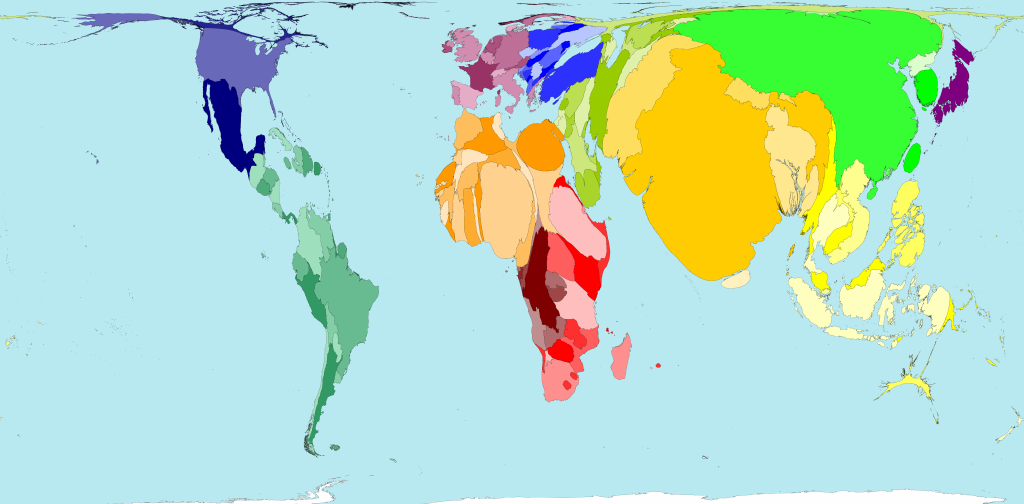
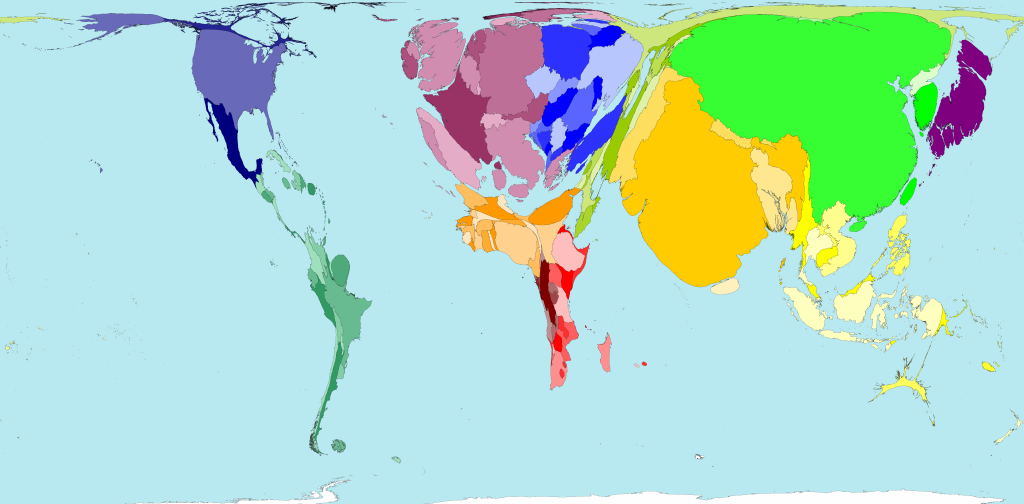
2. Total children

3. Total elderly
4. Tourist destinations
5. Tourist origins

These are density-equalising maps, known as cartograms. Once you've got the data, say from World Bank, you can use an algorithm (once used for linear diffusion from elementary physics*) to allow 'population to flow out from high-density to low-density areas'.
As promised, a bit of history now. But using cartograms to make this more entertaining.
Blown-up maps of population in:
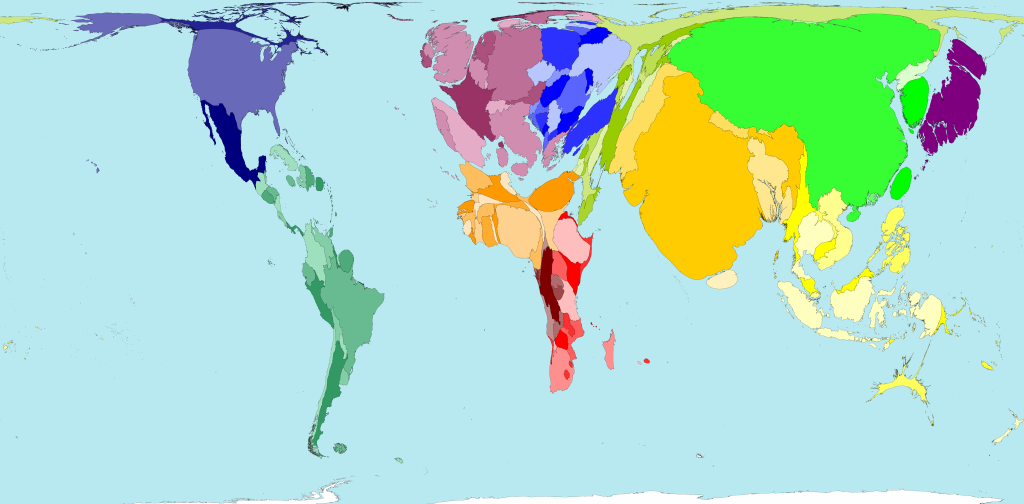
6. Year 1
"The population two thousand years ago is estimated to have been 231 million. At this time North and South America were sparsely populated, as was Asia Pacific. The estimated population of New Zealand was zero. Southern Asia, Northern Africa, China and Southern Europe (parts of the same land mass) had relatively high populations. Colder Northern latitudes tended to have lower populations.
The territories that now encompass the Ganges, Tigris, Yangtze, Nile and Po rivers were the most populous."
7. Year 1500
"At the time of Spanish conquest in South America, and when Christopher Columbus was exploring Central and South America, the combined population of Mexico and Peru was greater than the total of all other American countries.
The regions with the largest populations remained Southern Asia and Eastern Asia. Together these contained more than half of the world's population.
Worldwide population distribution in 1500 was roughly similar to that in year 1, despite the numbers almost doubling over this period."
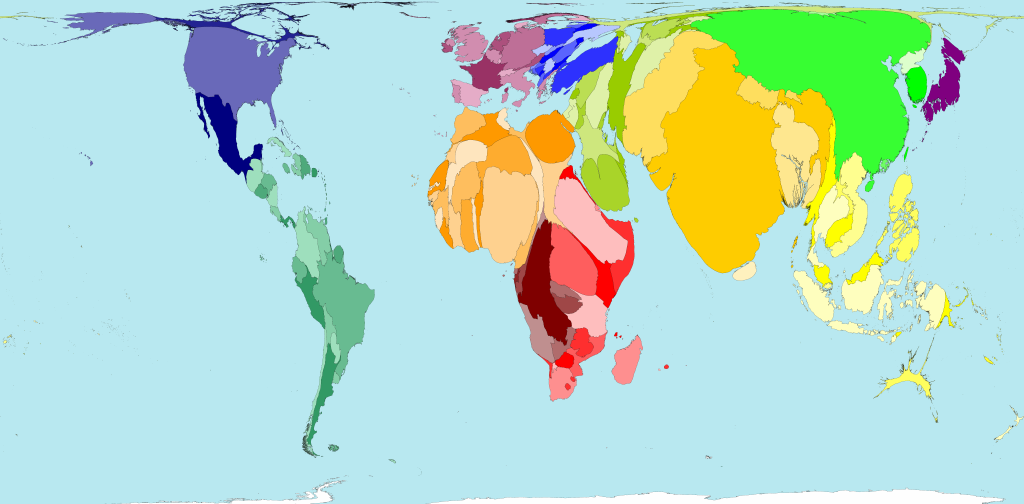
8. Year 1900
"The world population tripled between 1500 and 1900, to an estimated 1564 million. In that period, the populations of the United Kingdom and the United States increased more than ten-fold, the population of the Netherlands increased five-fold. For most of this time the Netherlands were known as the United Provinces; whilst neither the United Kingdom, nor the United States, had been formed.
In 1900 much of the world was under imperial rule, new territorial boundaries were being defined and contested. The borders of Africa shown in this map were mostly drawn at the Treaty of Versaille, in 1919."
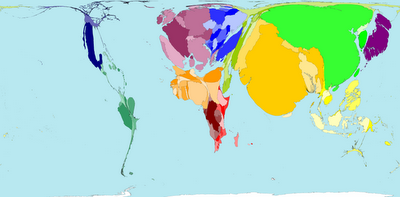
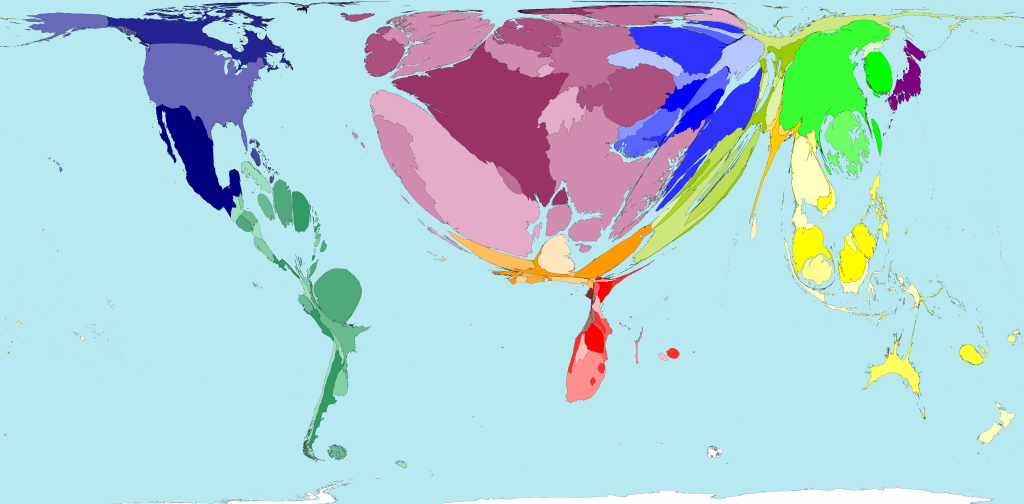
9. Year 1960
"The world population in 1960 was 3,039 million. As is the case today, the populations of China and India are (independently) more than twice as big as that of the next largest territory.
South America has increased its proportion of the world's population living there, since 1900. The Western European proportion of the world population began to decline in 1900 when it was 15%, to 11% in 1960 and then 6% in 2000."

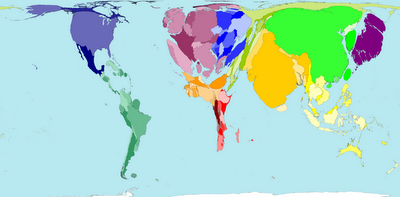
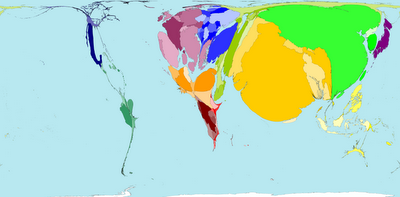
10. Now... close enough: Year 2000
"In Spring 2000 world population estimates reached 6 billion; that is 6 thousand million. The distribution of the earth's population is shown in this map.
India, China and Japan appear large on the map because they have large populations. Panama, Namibia and Guinea-Bissau have small populations so are barely visible on the map.
Population is very weakly related to land area. However, Sudan which is geographically the largest country in Africa, has a smaller population than Nigeria, Egypt, Ethiopia, Democratic Republic of Congo, South Africa and Tanzania."
And now, a bit of future too.
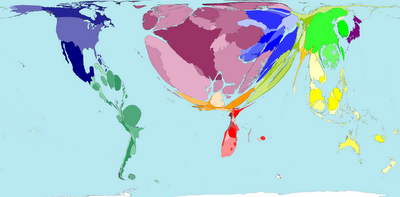
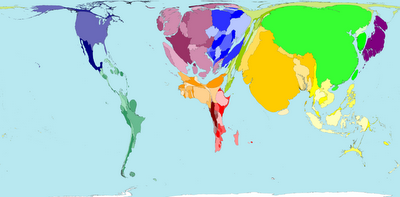
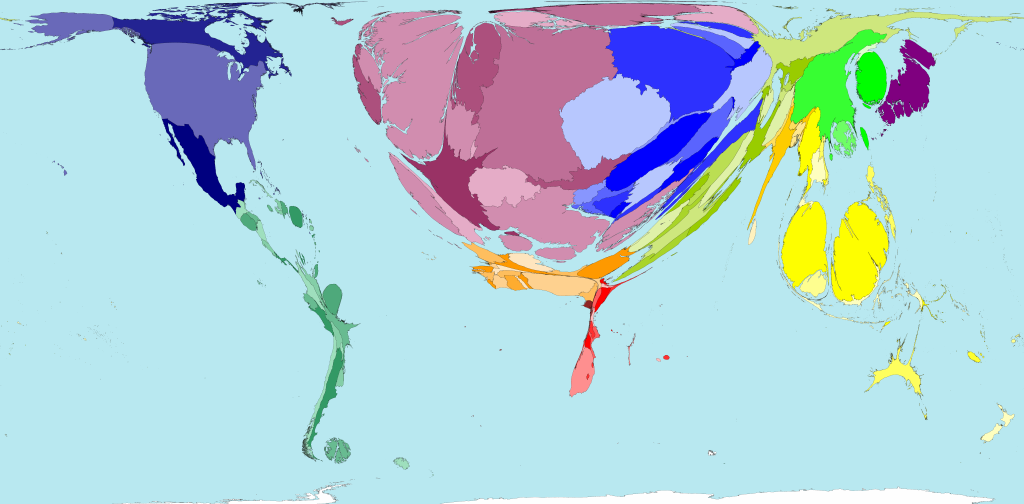
11. Year 2050
"By 2050 it is estimated that the earth's human population will be 9.07 billion. 62% of the people will live in Africa, Southern Asia and Eastern Asia - numerically this is the same as if all the world's current population lived just in these regions. In addition another 3000 000 000 will be spread accross the rest of the world.
All numbers shown here are estimates - estimates are never perfect."
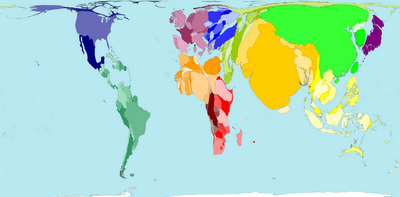
12. Year 2300
"By 2300 the United Nations forecasts that the global population will be just under 9 billion. World population is expected to rise, peak and then decline slightly between 2050 and 2300. The highest long term population growth is predicted for Africa. Africa is currently underpopulated and has the lowest life expectancies. Other regions' populations are predicted to stay level or decline. Between 2050 and 2300 the areas currently known as India, China, the United States and Pakistan maintain their ranked order as having the world's highest populations. The numbers shown here are estimates - based on predicted future behaviours."

I hope that was an interesting and educating experience because it sure was for me.
All maps and quoted text from World Mapper
*for more information on cartograms and how to generate them visit Cartograms from Physics
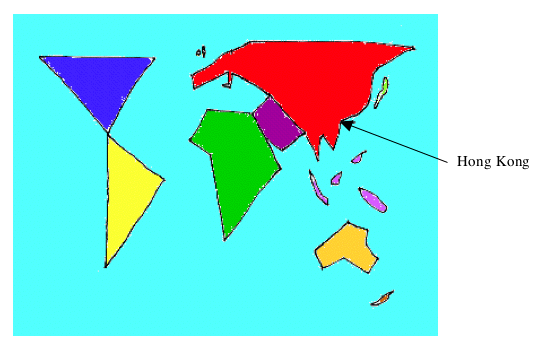
Just for fun, here's my clumsy attempt at drawing the world map:

But more importantly, the map shows the vague location of Hong Kong, for those who doesn't know where it is.

It's the famous Peters projection - the Area map. Okay let's give it credit for giving us a general idea of the spatial structure of the land mass on Earth, but the maps below will blow your mind.
1. Upside down

This is easy to obtain - I've done this myself - just rotate the original map by 180º. But it does change the way you view the world.
You may say boring... now what? How about using an algorithm now, to blow up the map according to:
2. Total children
3. Total elderly

4. Tourist destinations
5. Tourist origins
These are density-equalising maps, known as cartograms. Once you've got the data, say from World Bank, you can use an algorithm (once used for linear diffusion from elementary physics*) to allow 'population to flow out from high-density to low-density areas'.
As promised, a bit of history now. But using cartograms to make this more entertaining.
Blown-up maps of population in:
6. Year 1
"The population two thousand years ago is estimated to have been 231 million. At this time North and South America were sparsely populated, as was Asia Pacific. The estimated population of New Zealand was zero. Southern Asia, Northern Africa, China and Southern Europe (parts of the same land mass) had relatively high populations. Colder Northern latitudes tended to have lower populations.
The territories that now encompass the Ganges, Tigris, Yangtze, Nile and Po rivers were the most populous."

7. Year 1500
"At the time of Spanish conquest in South America, and when Christopher Columbus was exploring Central and South America, the combined population of Mexico and Peru was greater than the total of all other American countries.
The regions with the largest populations remained Southern Asia and Eastern Asia. Together these contained more than half of the world's population.
Worldwide population distribution in 1500 was roughly similar to that in year 1, despite the numbers almost doubling over this period."

8. Year 1900
"The world population tripled between 1500 and 1900, to an estimated 1564 million. In that period, the populations of the United Kingdom and the United States increased more than ten-fold, the population of the Netherlands increased five-fold. For most of this time the Netherlands were known as the United Provinces; whilst neither the United Kingdom, nor the United States, had been formed.
In 1900 much of the world was under imperial rule, new territorial boundaries were being defined and contested. The borders of Africa shown in this map were mostly drawn at the Treaty of Versaille, in 1919."
9. Year 1960
"The world population in 1960 was 3,039 million. As is the case today, the populations of China and India are (independently) more than twice as big as that of the next largest territory.
South America has increased its proportion of the world's population living there, since 1900. The Western European proportion of the world population began to decline in 1900 when it was 15%, to 11% in 1960 and then 6% in 2000."
10. Now... close enough: Year 2000
"In Spring 2000 world population estimates reached 6 billion; that is 6 thousand million. The distribution of the earth's population is shown in this map.
India, China and Japan appear large on the map because they have large populations. Panama, Namibia and Guinea-Bissau have small populations so are barely visible on the map.
Population is very weakly related to land area. However, Sudan which is geographically the largest country in Africa, has a smaller population than Nigeria, Egypt, Ethiopia, Democratic Republic of Congo, South Africa and Tanzania."

And now, a bit of future too.
11. Year 2050
"By 2050 it is estimated that the earth's human population will be 9.07 billion. 62% of the people will live in Africa, Southern Asia and Eastern Asia - numerically this is the same as if all the world's current population lived just in these regions. In addition another 3000 000 000 will be spread accross the rest of the world.
All numbers shown here are estimates - estimates are never perfect."

12. Year 2300
"By 2300 the United Nations forecasts that the global population will be just under 9 billion. World population is expected to rise, peak and then decline slightly between 2050 and 2300. The highest long term population growth is predicted for Africa. Africa is currently underpopulated and has the lowest life expectancies. Other regions' populations are predicted to stay level or decline. Between 2050 and 2300 the areas currently known as India, China, the United States and Pakistan maintain their ranked order as having the world's highest populations. The numbers shown here are estimates - based on predicted future behaviours."
I hope that was an interesting and educating experience because it sure was for me.
All maps and quoted text from World Mapper
*for more information on cartograms and how to generate them visit Cartograms from Physics
Just for fun, here's my clumsy attempt at drawing the world map:
But more importantly, the map shows the vague location of Hong Kong, for those who doesn't know where it is.
posted by Eau at 10:52 am
![]()

4 Comments:
HMMMMM!! how educational..although i didn't get anything about it. and i dont want to. because i HATE geography :P hhahaha! aiyaa i miss u lots! not sure if u still rmb me haha bt hmm hope to see u sum time this summa!
xxx
lucy
so this is what you do in your freizeit... interesting. looking forward to your next update! :) and btw, good work on period 4, we're still 14 mpi ahead.
eco11
lucy, of course I remember you, from 'isl' school right?
eco11,
yes this is what i do in my freizeit recently, since literally a few days ago.
and yes we are still 14 mpi ahead, but you forgot that we are also 4 mpi behind.
***
oh and I almost forgot to thank you for your comment(s)
see you in thirteen days or so...
Post a Comment
<< Home